What are the Designated State Health Programs?

The CIP codes we used (CIP stands for Classification of Instructional Programs) were identified by EOHHS and presented to CMS as a key part of the Claiming and Tracking methodology. As you can see, some CIPs or entire CIP families (such as Residency Programs) did not produce any graduates who went on to employment in one of the targeted subsectors.
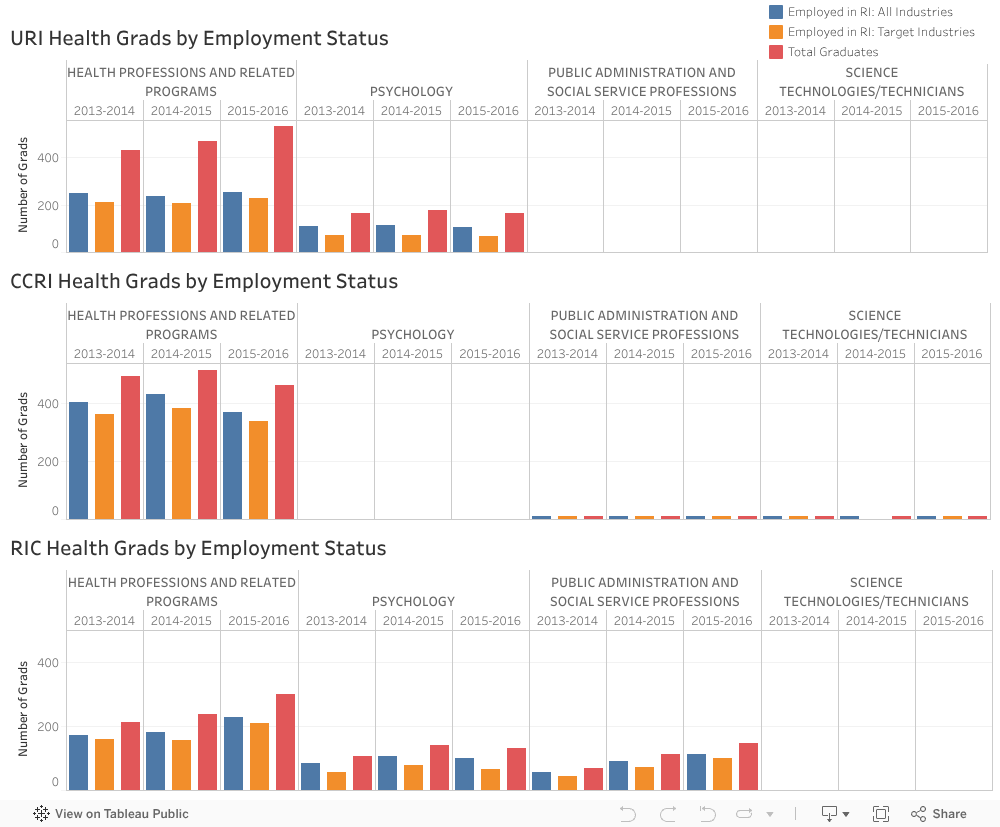
Are 2013-2016 health grads working in RI? Are they working in the targeted industries?
The NAICS classification system groups employers into 2-digit groupings (Sectors), 3-digit groupings (Subsectors), and 4-digit groupings (Industries). This analysis focused on "target industries" in the Health Care and Social Assistance and Education sectors, as well as selected industries in other Sectors, like Health & Personal Care Stores (where many of our Pharmacy grads end up).
This visualization shows, by institution, the total number of graduates in each CIP Family, the number of graduates employed in Rhode Island in ANY industry within one year of graduation, and the number employed in one of the target industries. We can see that Health Professions and Related Programs, not surprisingly, produce the most graduates and that CCRI and RIC graduates of those programs are more likely to be employed in RI.
Looking at fields of study by year, in what industries are 2013-2016 grads employed?
This analysis looks at grads across 3 consecutive years. We looked to see if the group had employment records in RI for one year following graduation and whether they were employed in the target industries. No notable difference in employment is present through the visual layout, and we didn't do any bivariate analyses or testing for correlation. You can see, though, that Hospitals are the largest employer by far, with a roughly even amount of employees coming from Designated State Health Programs at all 3 institutions. Note that Hospitals includes State and Local, but not federal entities.
Looking at fields of study by institution, in which industries are 2013-2016 grads employed?
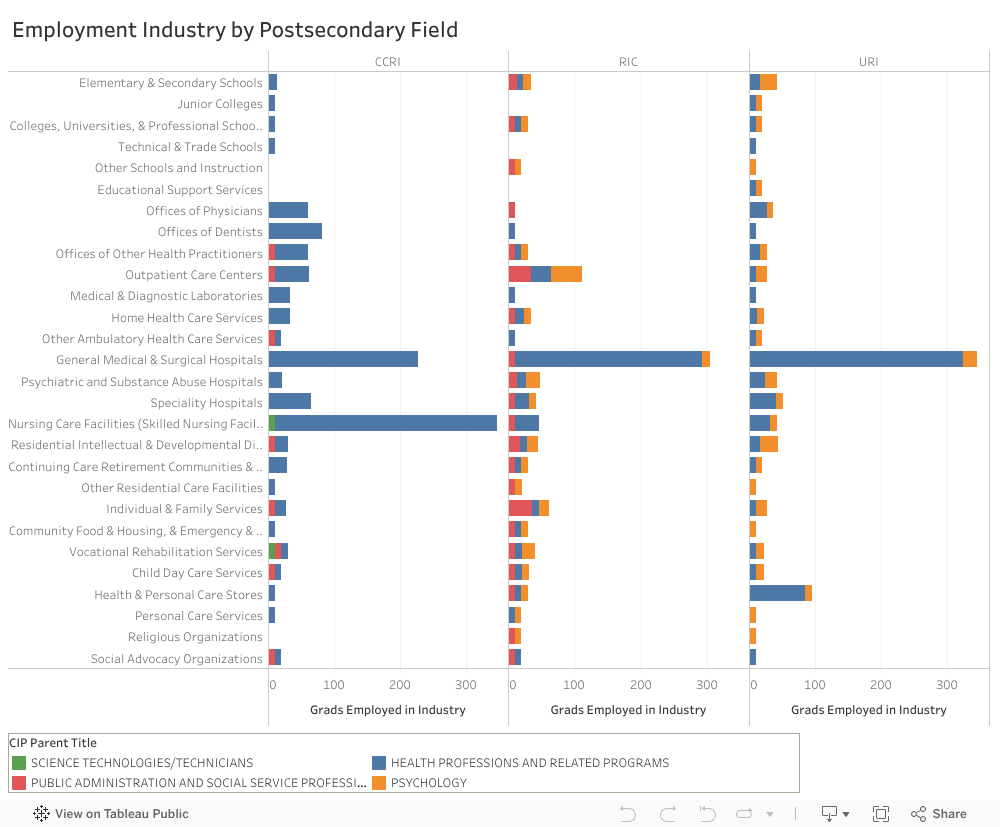
If we look more closely at the industries in which these grads were employed, General Medical and Surgical Hospitals are placing the highest number. CCRI is producing many grads from Health Professions CIPs who are going onto employment in Skilled Nursing Facilities and secondarily, in other Ambulatory Care settings. Again, these are grads one year out, so we're not catching who are out of the workforce because they're obtaining more education than an associate's or Bachelor's degree.
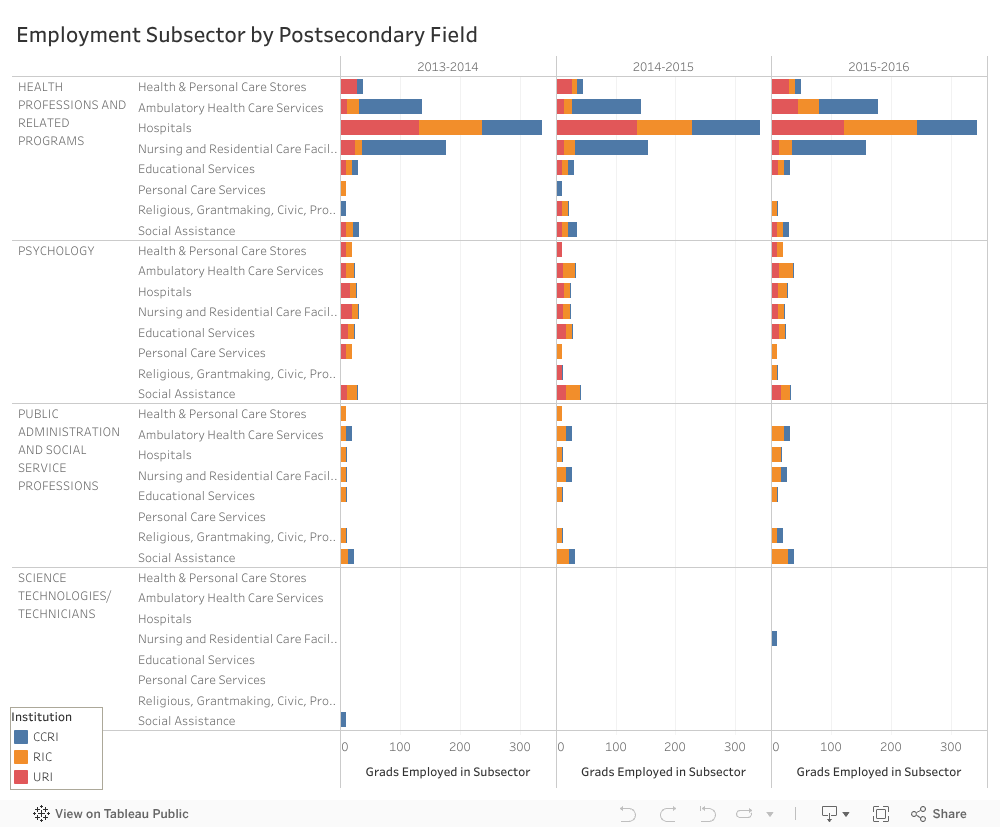
In what subsectors are 2013-2016 grads from each degree program employed?
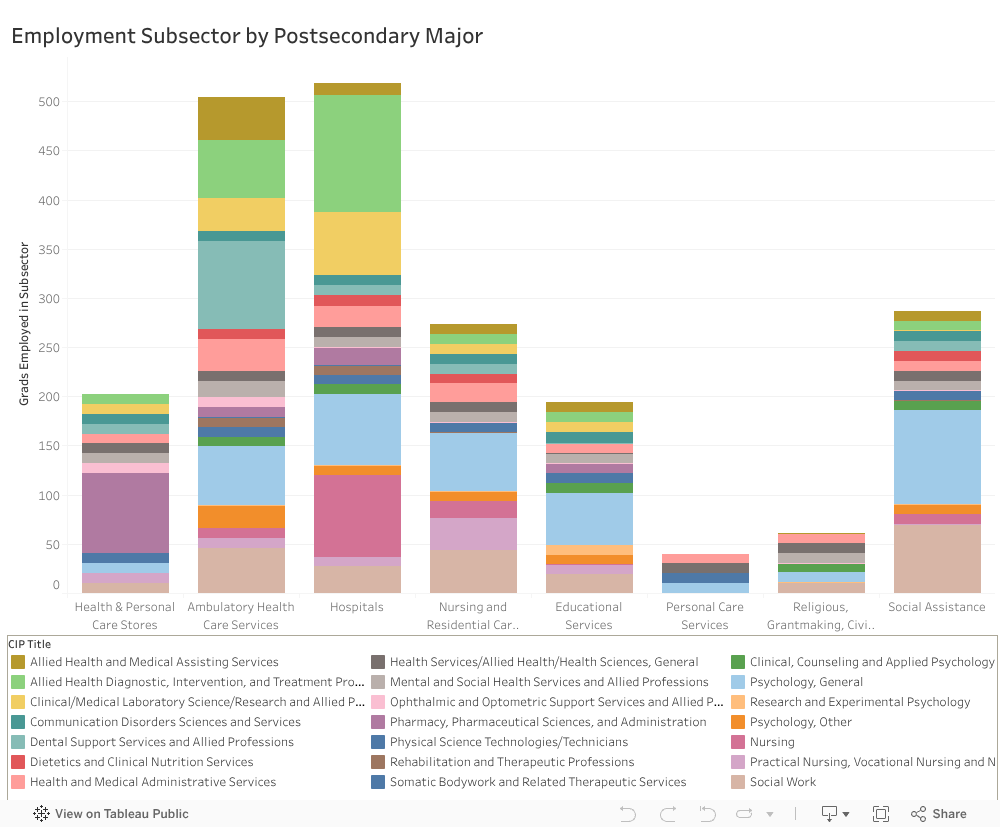
This visualization shows the overall numbers of grads employed in each Subsector--over 500 each in Hospitals and in Ambulatory Care Services, across the 3 years and 3 institutions. This analysis does not track whether grads continue to be employed in RI or with these employers after one year post-graduation. Note that Social Work and Psychology programs are feeding grads into almost all of these Subsectors. Note also that very few grads from 1) Mental and Social Health Services and Allied Professions and 2) Clinical, Counseling, and Applied Psychology are finding quick employment in these target industries, although it's clear the need for trained professionals at the AA and BA level exists.
In which of the target industries are 2013-2016 health grads from each institution employed?

This is a look at the more granular industry-level data by institution and year. There's a slight decline in the number of URI grads employed at General Medical and Surgical Hospitals over the 3 year period, and a slight increase in the same data for RI and CCRI.
Where are 2013-2016 grads of RN programs--the largest group of health grads--employed?

We looked a bit more closely at RNs, which are the biggest single group of grads across the 3 institutions. Not surprisingly, most RNs are employed at General Medical & Surgical Hospitals and Skilled Nursing Facilities. Note that there are few RNs employed in the Education Services subsector and the Social Assistance subsector. Those interested in RNs' starting wages might also note that Offices of Physicians, where one might expect better pay, are not employing a large number of our RNs. Do they not employ many RNs in general, or are they employing RNs produced at other institutions?