Click on the name of the indicator you wish to change. From this new window, remove the old indicators, browse through the many data sets available, and choose the new indicator you are interested in viewing.
Please contact questions@ridatahub.org if you think that the software is not performing as it should.
These numbers represent the number of indicators in your ilist available for that data level.
Yes you can! To learn how to upload your own data, view our user guide on uploading data here.
Weave is the open source web-based visualization software through which anyone can create graphs and maps on the the DataHUB. Weave stands for Web-based Analysis and Visualization Environment and is developed by the Open Indicators Consortium. Click here to get more information about the Open Indicators Consortium.
An introduction to the RI DataHUB. Learn what the DataHUB is, how it works, and how to navigate the site.
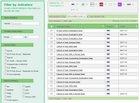
Learn how and why to create an ilist and how to use the data catalog to browse and find the data you are interested in.
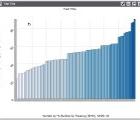
Step-by-step instructions on how to make a basic bar chart.